Originally published on LATKA’s SaaS.
tl;dr: Run a few searches (patterns provided) on LinkedIn and Google to determine the current reps and churned reps per year for any given company. Divide churned reps per year by the current number of reps to compute the percentage of the current sales team that will churn in one year’s time – producing the Sales Team Churn (STC) metric. Can compute STC for any company (including privately held ones), and compare to other companies’ STCs (see benchmarks table covering several key SaaS companies below).
To compute this sales performance metric, you need to run three simple searches.
First, search for the company on LinkedIn – “in People” search:

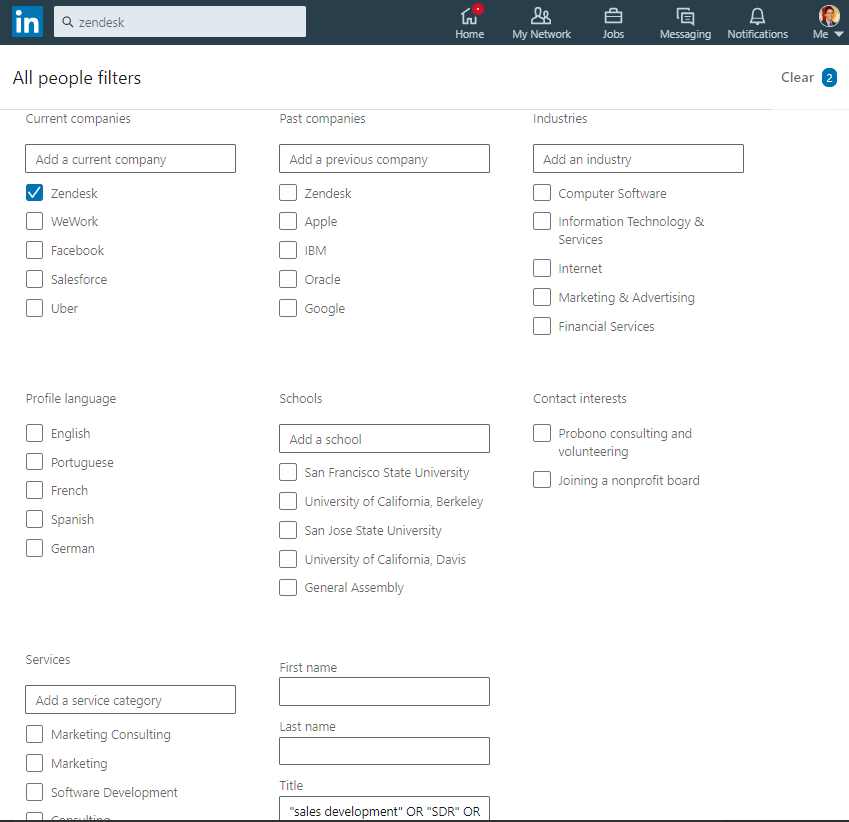
Then click “All Filters” near the top right of the search results page, check the company under “Current companies”, and in the “Title” field (near the bottom of the form), copy and paste the following string:
“sales development” OR “SDR” OR “account executive” OR “sales executive” OR “account manager”
Then click “Apply”.
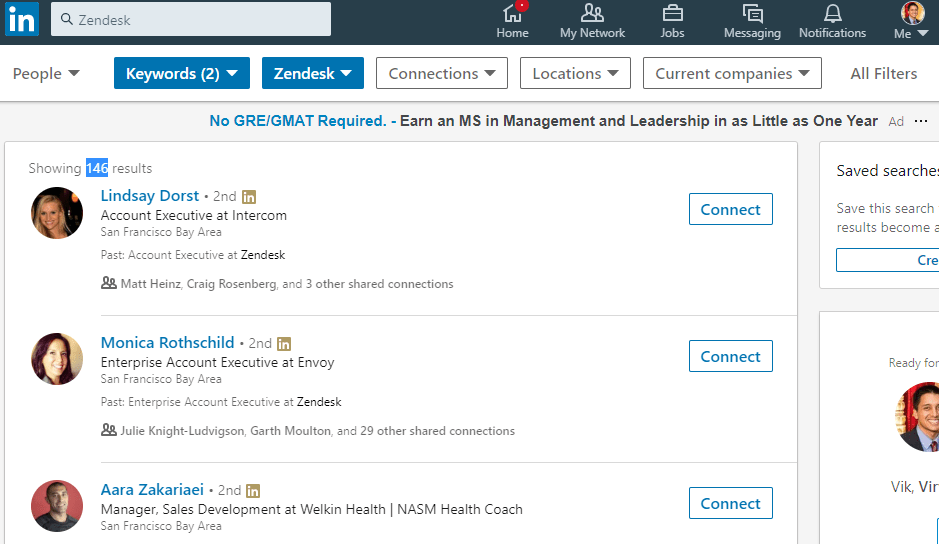
Near the top left of the search results page is the number of results (highlighted in blue in the image below). Save this figure, which represents the current number of sales related heads at the company.

Then click “All Filters” again. Uncheck the company under “Current companies”, and check the company under “Past companies”. In the “Company” field box, enter “-” then the company name (in quotes if company name is more than one token).

Click “Apply”, and save the number of results, which represents the number of sales related heads that no longer work at the company.
Then search the company name padded with “founded” on Google, and find the date the company was started.
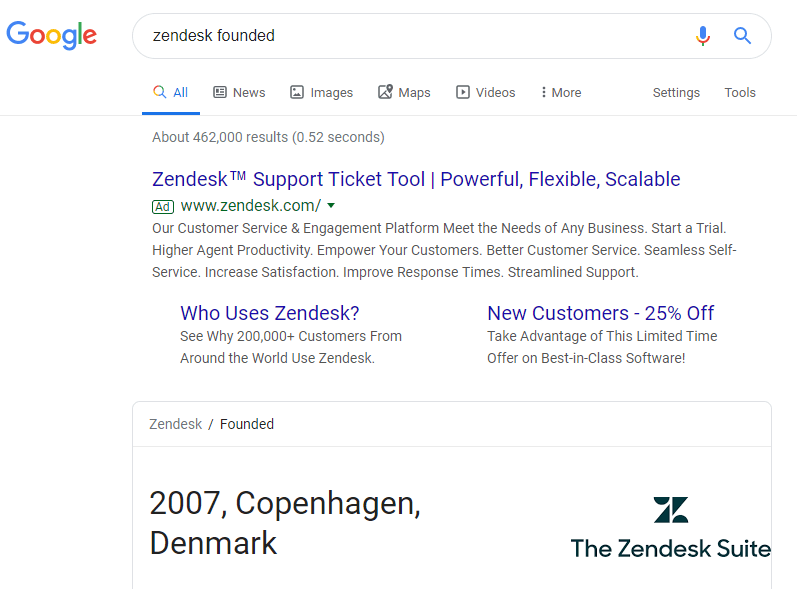
These three searches give us current sales heads, past sales heads, and the founding date of the company.
With these three values, we can calculate the following:
Churned Sales Heads Per Year = Past Sales Heads / Number of Years Since Founded
Sales Team Churn (STC) = Churned Sales Heads Per Year / Current Sales Heads
This metric represents how much of the current sales team will churn in one year (so lower the number the better).
Let’s plug-in the example illustrated in the screenshots above:
Zendesk, founded in 2007, has currently 476 sales related heads, and has lost 146 heads.
Churn per year = 146 / (2019 – 2007) = ~12
STC = 12 / 476 = ~2.5%
So, what’s a good STC score? Here are the metric values for various enterprise companies (full table here):
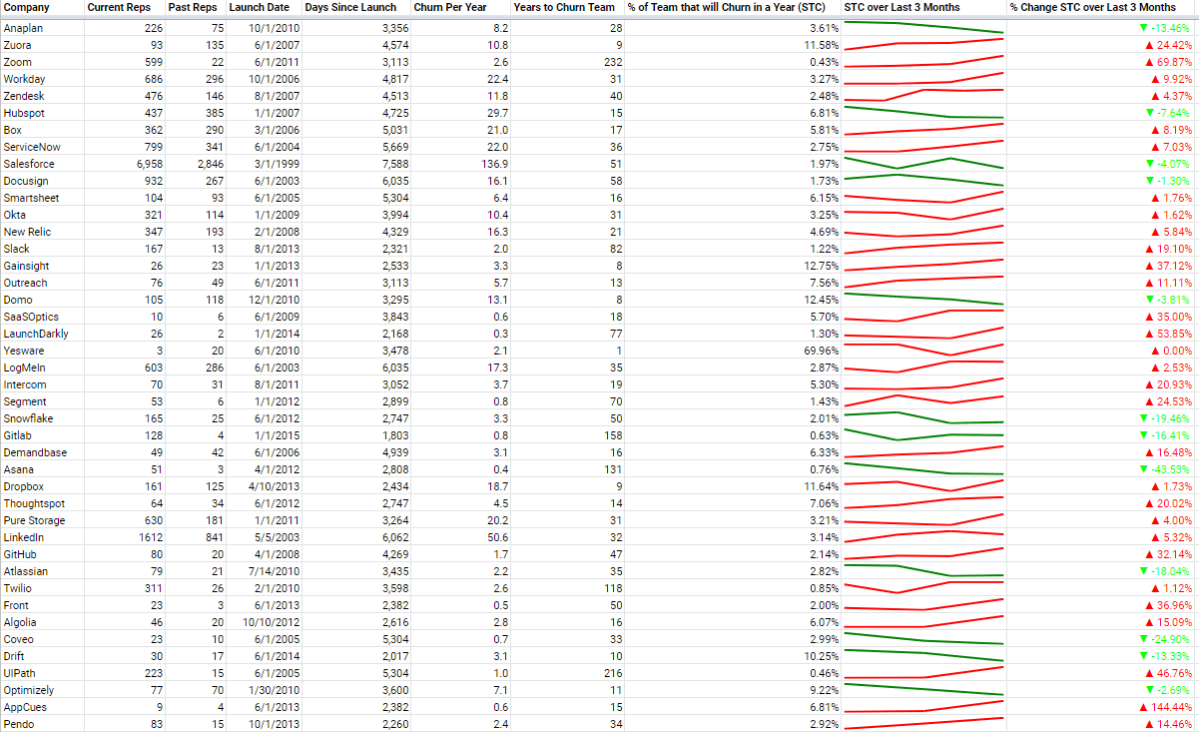
The key columns are the last three. Lower STC the better. Been capturing monthly snapshots of STC values for these basket of companies – sparkline and percentage changed provided in the last two columns. Ideally, STC is below 5%, and the STC is steady or going down over time (in green if going down – otherwise red). See full table here.
The average of this basket of companies is 5.9% – so would recommend targeting under 5% in general. This sounds low, but that’s because churn per year is calculated over all time – since the incorporation date. This is because I was unable to filter LinkedIn search results to a select period of time (like over the past year). In the early years, sales and corresponding sales churn will be low or nonexistent, which heavily down weights this value. As companies age, the number of years increases, and the number of current sales reps increase, which can both lower this score. This is how even a mature company intentionally churning out 10-20% of their sales team annually (to remove bottom performers and raise the bar for all reps) can still score a STC below 5%. The key is to compare STC with other companies at similar stages versus directly comparing with internal annual attrition numbers given the differences in calculation methods and assumptions.
There are many interesting insights to glean from this table. For example, there are several companies with < 1% STC, including LaunchDarkly, Zoom (although growing), Twilio and GitLab – all of which have self-service trial flows.
There are also companies with > 10% STC percentages (to reiterate – this means more than 10% of their sales team will attrit in a year), including Domo, Dropbox, Gainsight and Zuora.
There are interesting competitive benchmarks as well – for ex. Intercom is 5.3% vs Drift’s 10.27% – nearly half of Drift’s sales churn.
I’ve been snapshotting this metric for several months, as it’s also important to look at how STC is changing over time (see last column above – is the sales health getting better or worse?). There are companies on this list who have consistently increased (Gainsight, Zuora) or decreased (Anaplan, Domo) their STC.
So, why the focus on sales team size for assessing the sales performance of a company?
When I was running Infer, I recall my syncs with Aaron Levie (CEO / Co-Founder of Box, and one of our angel investors at the time), and the first question he would always ask was:
“How many salespeople do you have now?”
This is a really great question for assessing a business quickly. The more reps you have, the more deals you can close. The more reps you have, the more market demand you have. The more reps you have, the more you’re spending to drive growth. The more reps you have, the better your hiring process, sales leadership and culture are for attracting talent.
The twist with STC, is that we’re not just looking at the number of present sales people, but also factoring in the attrition rate. So, the less reps churned, the more reps that are hitting their quotas.
C-level executives focus on key business metrics such as gross or net revenue retention. High churn means there’s a leaky bucket, which can sink even a high growth new ARR business.
This applies not just to customers, but to sales reps too – often overlooked compared to customer churn. If a company is losing a good chunk of their sales team each year, then the company is losing the ability to generate and close revenue making opportunities, and has to spend to hire new reps – and burn valuable time ramping them.
In general, sales reps face higher risks of attrition than those in other functions. Their goals are measurable, and if they miss, they’re fired or leave – and the best performing reps can receive promotions and make more money elsewhere. But even if higher attrition is expected, what is the healthy, right amount of attrition for any given company to experience?
Losing reps is very much a leaky bucket just like customer churn, and deserves metrics and magic numbers to abide to – hence STC and the 5% target.
The STC metric has several nice properties:
It’s accessible, and can be computed for any company (unlike revenue which is hard to reliably discern for private companies). Anyone can quickly and easily derive this metric with a free LinkedIn Account. It does not require internal financials – so it’s fully transparent internally and externally. The metric is normalized, so can compare companies’ STCs for benchmarking purposes. This metric updates often (as sales people tend to update their profiles quickly). It’s also a more forward looking indicator than revenue (need sales people first before closing more deals).
This metric can also be adapted to different roles outside of sales by simply changing the title query (could tailor to executive management roles with search tokens like “Chief”, “VP”, etc.).
VPs of Sales, CEOs, VCs, VPs of FP&A, job candidates, hedge fund quants, etc. should be leveraging STC-like metrics for planning models, researching competitive landscapes and evaluating investments or job opportunities.
Special thanks to the following for reviewing drafts of this piece:
Ajay Agarwal, George Bischof, Matt Cooley, David Gilmour, Amar Goel, Naren Gupta, Nathan Latka, Nick Mehta, David Kellogg, Vish Makhijani, Tomasz Tunguz and Jeff Weiner.
***
Do note, some technical caveats regarding this approach for computing STC:
Can be difficult to be precise with LinkedIn’s search. Two examples: (1) company name may overlap with other companies with similar names (2) can’t search past titles (at least via the free account) (3) have to negate ‘-’ company name in order to find people that worked in the past at a company and are no longer at that company
If a company is fresh and hasn’t had any churn (or really low churn), then this is meaningless (it has the best STC score). Just means they haven’t had enough sales team churn yet. Still useful to look at comparable companies who’ve been in-market longer and use their STC scores for headcount planning / forecasting.
Different companies use different sales titles. May need to adjust the title query on a per company basis.
The sales titles query does not exclusively correspond to quota carrying reps.
Not everyone is on LinkedIn. This is usually not a problem for sales reps as they typically want to advertise themselves in order to be able to connect with potential customers – esp. at tech companies. Even when not all sales reps are accounted for (when a rep is not on LinkedIn or the title query doesn’t capture that person), I find that this metric is still directionally useful especially on a relative basis with other companies (it’s consistently sampling each company in the same manner).
